
08/05/26 Update
Risk On

The Nasdaq reversed its 6 day losing streak with 4 violent green days in which the Composite rose 9.5%. As was posited last week, the Wednesday evening block trade of the bulk of Situational Awareness’ public holdings marked the ST bottom, and it is looking highly likely to be an IT bottom as well. SPX and RUT made new all time highs during the period, despite the short term leadership of tech. In addition, both indices made new Advance/Decline highs which are important indicators of breadth. So my underlying read on equities, and that of the technicians I respect most, is that we remain firmly in a bull market in both the short, intermediate and long term.
As always, there are bearish narratives circulated ad nauseum. We have already established that middle east headlines are the ripples that Charles Dow warned us about, and I view the Fed as a wave - the underlying economic conditions and the flows of money are more important than the policy reactions that result. Now this is not to say that the Fed is not material to the markets, of course it is, as any large wave is to a body surfer. Therefore the unprecedented uncertainty of Fed policy remains equally relevant. As of this writing the Fed Funds futures in the CME show 57% probability of a hike in the September FOMC meeting, and an 82% probability of at least a hike by the end of the year. While the market is uncertain about individual Fed actions, it has priced in that we are in a hiking phase not an easing phase. Therefore news to the contrary will have more impact, and that remains a possibility.
As I said in my last post, the longest term waves, longer than the Fed, are pointing to a competition for capital and a long term period of growth in investment, earnings, wealth, spending and income. We are 60% of the way through the Q2 earnings season, 86% of the reports of the S&P 500 have beaten expectations, and the cumulative outperformance on earnings is 31% higher than expectations. This number is vastly skewed by the Alphabet and Amazon blowout announcements. Nevertheless its an important conclusion that the appreciation we are seeing in 2026 is driven not by multiple expansion but by earnings growth. I draw your attention to this chart posted by Jurrien Timmer of Fidelity:
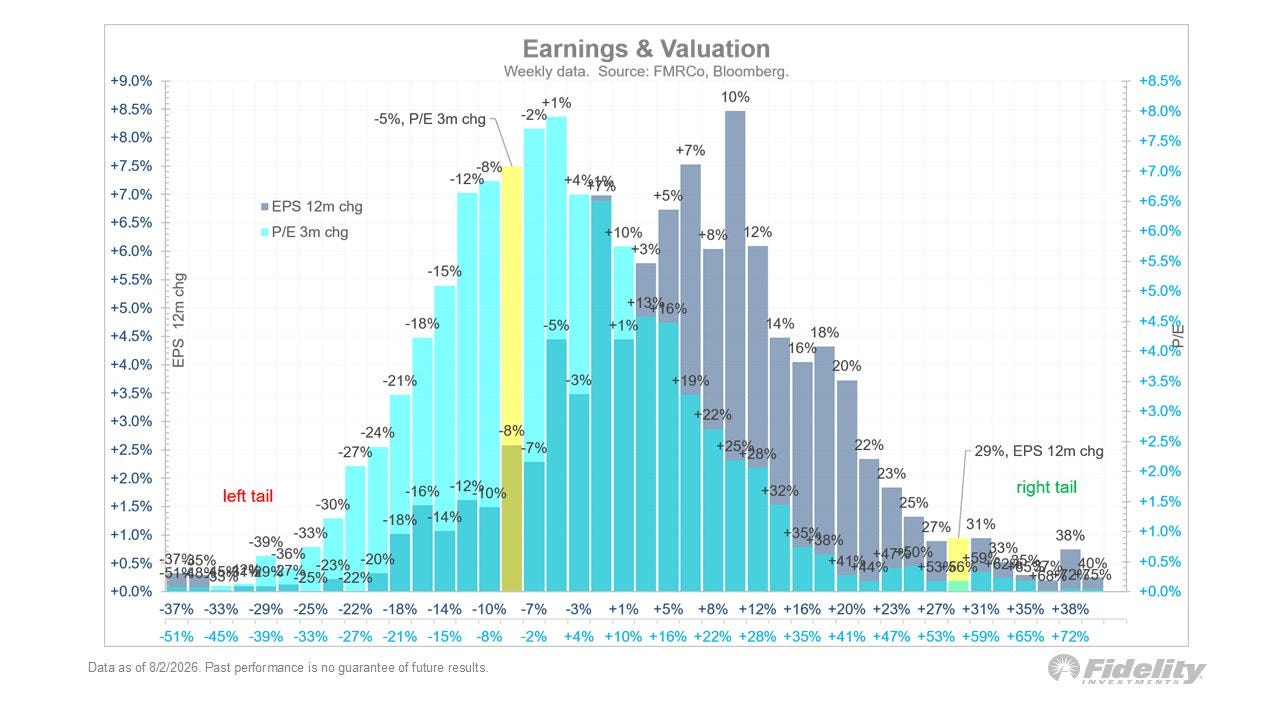
This chart shows both earnings growth and multiple expansion and the yellow lines are where we are currently, vs historical periods. The 29% EPS growth over the last 12 months sits far to the right of the mean, eyeballing it looks like a 3 standard deviation excess. Meanwhile the 3 month change in PE is -5%, on the left of the average. Looking forward, the 2026 consensus S&P 500 EPS estimate has now risen to $351 which is 24% higher than 2025. This is an earnings driven bull market, with strong breadth and participation from both the old economy (NYSE) and Tech (Nasdaq). These are the things that lead me to maintain my recommendation to be fully invested in equities. The Fed rule today reads: S&P earnings yield of 4.54%, 10 year UST 4.62% - equilibrium.
Before I move behind the paywall to specific recommendations for my paid subscribers I want to add another concept, and that is the difference between a secular bull market and a cyclical bull market. Charles Dow did not differentiate these in his writings, although I think he would have called a cyclical bull the tide, the primary trend. Nevertheless, there is in fact a conceptual difference between a long term bull trend which incorporates recessions or other drawdowns in excess of 10%. I do subscribe to the definition of a correction being 10% and I would recommend all of my readers to read Norseman Market Timing’s publications (which are above his paywall) which discuss what he calls the “Bull/Bear Line” which is 10% below the last all time high. His work indicates this is a structurally important level which when not breached indicates a healthy and ongoing cyclical bull, when breached once is a sort of “two strikes” condition and when violated twice ends that bull. In addition a 20% drawdown event by itself ends it as well, although the goal is to see it coming by paying attention to the behavior of the market when it approaches the Bull/Bear Line. But the term secular bull market can encompass multiple cyclical bull markets, multiple violations of the Bull/Bear Line and multiple 20% cyclical bears. Like Norseman, I do not subscribe to the notion of holding through an entire secular bull market, I seek to reduce my exposure to a drawdown of more than 10% when the odds of a cyclical bull ending are high, and participate above the benchmark exposure when the odds are low. And that’s why I’m writing this newsletter….
So on to my specific recommendations for my paid subscribers:
