
07/23/26 Update
Identifying the patterns amidst the noise

The markets revealed some clues this week, if you can look past the headlines. The headlines were that the Middle East heated up again with both Iran and the US launching missile attacks at each other. Rates had an enjoyable week last week celebrating the unexpected drop in CPI and PPI but were abruptly awakened by the news. The 2 year UST is up 25 bps on no new economic data, the 10 year has hit a 52 week low in price/high in yield of 4.7%, and stocks have suffered alongside.
The most significant pattern that can be seen from this week, and today as a decisive confirmation of a trend that can be tracked clearly since June 1 and less clearly since the start of the conflict on 2/27/26, is that equities and rates have begun to strongly correlate again. This is a big deal. As all my committed readers know, Wall St uses the inverse correlation of bonds and stocks as the key method to achieve diversification with their clients fully invested. This broke down in 2022 with both asset classes suffering severe damage together. But in the last couple of years the historical inverse correlation had reverted. But we are now seeing a return to the correlation we saw in 2022. Barron’s published an article about it:
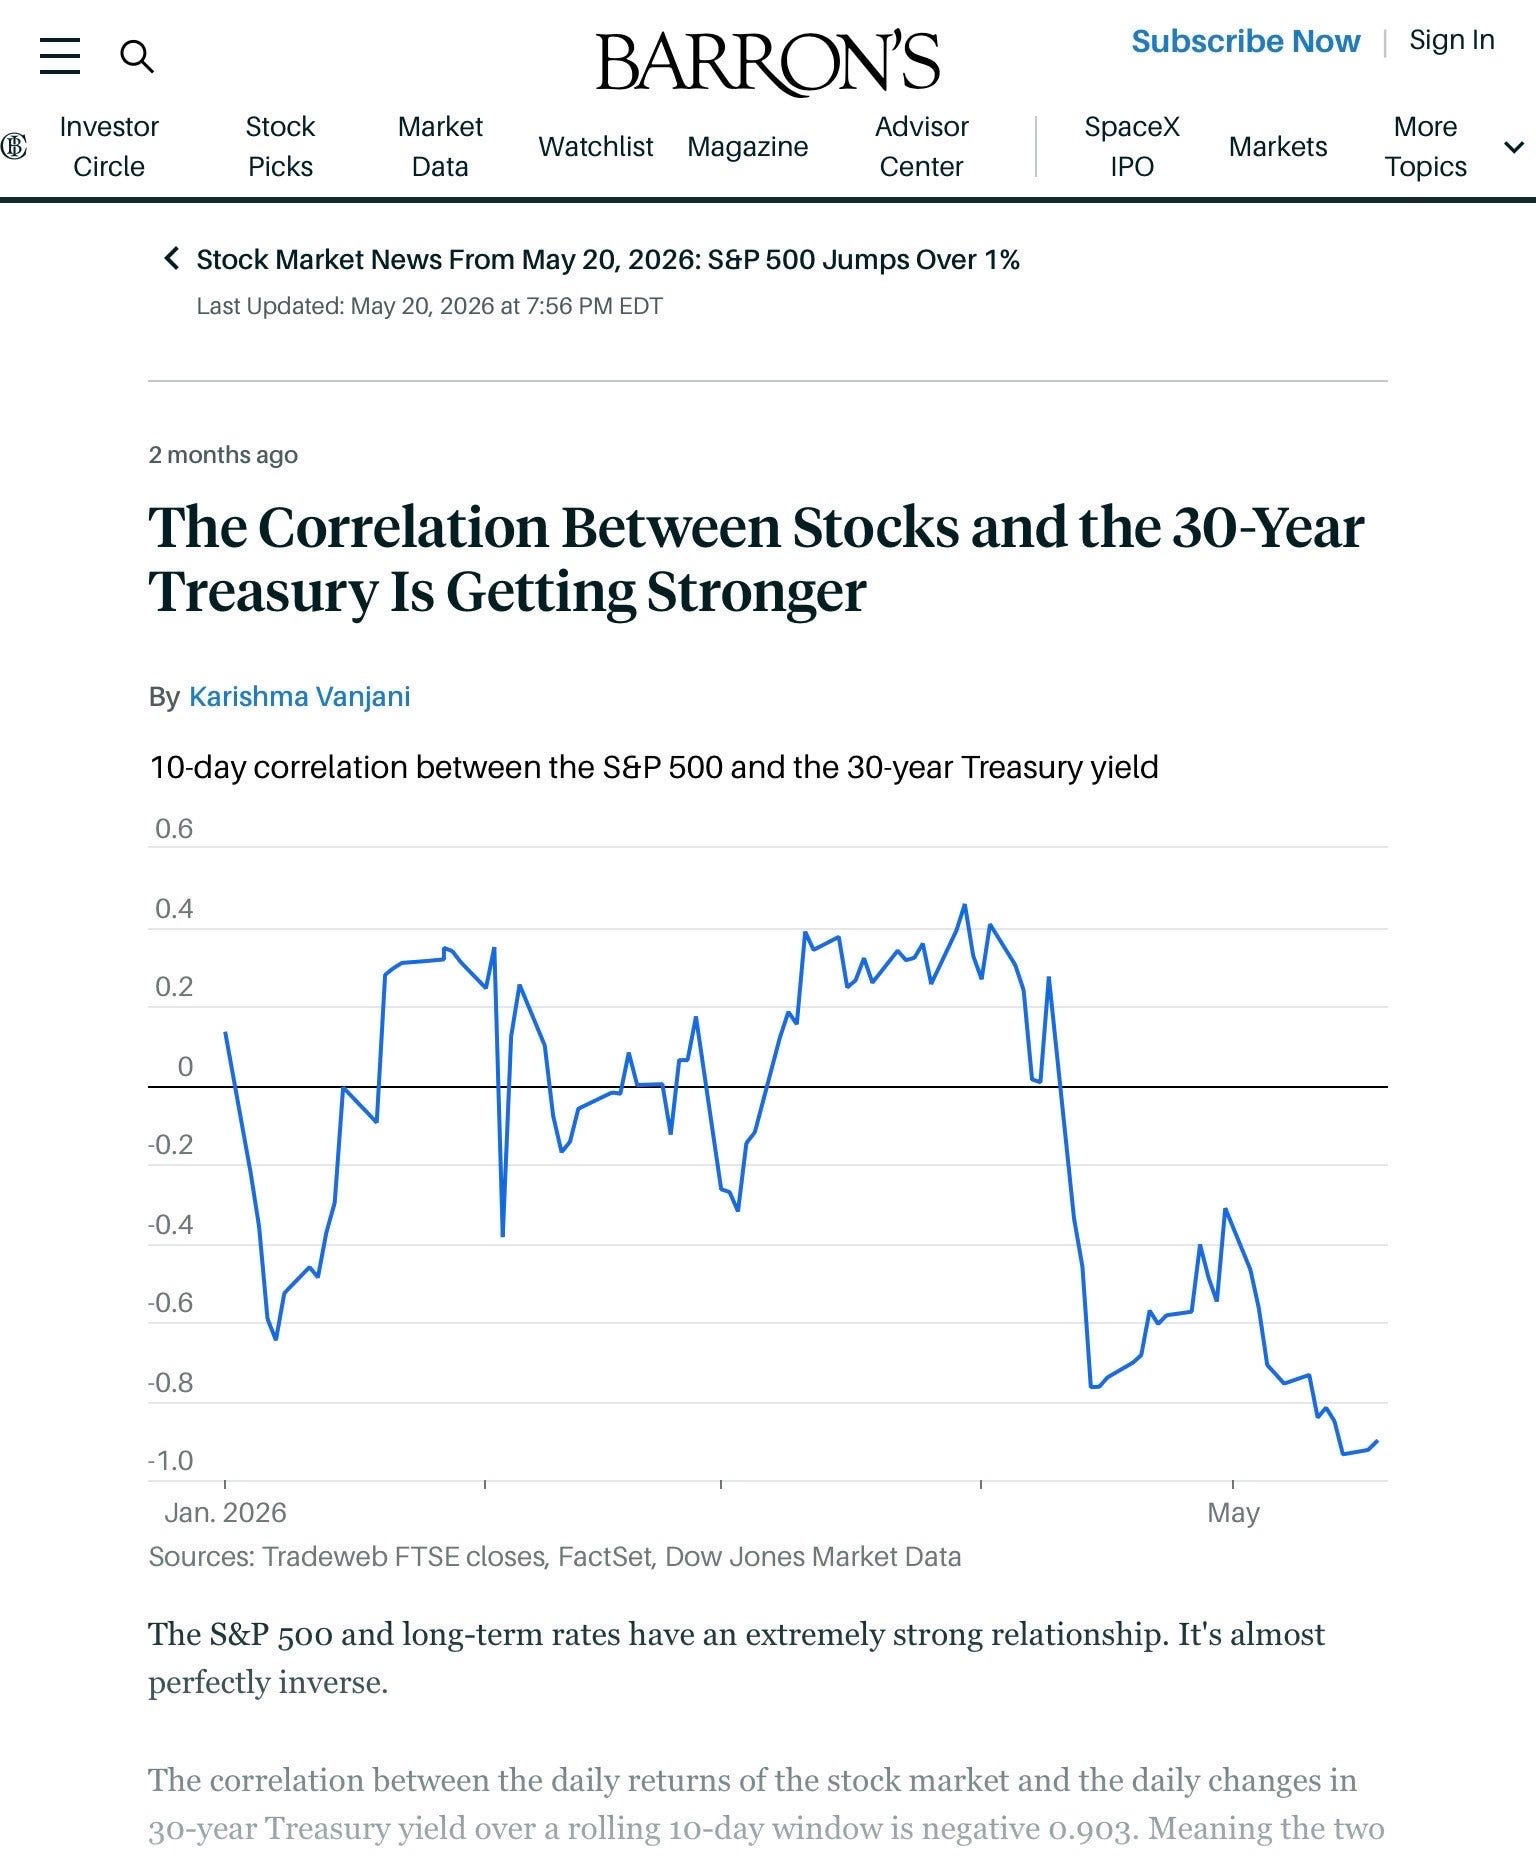
Now an inverse correlation between stocks and bond yields is a positive correlation between stocks and bond prices. This means that when bond prices go up and yields go down stocks are rising, and vice versa.
But I would like to take this assessment another level deeper, because within equities we are seeing a sector driven pattern. And that is when Bond prices are falling (yields rising), Stocks are falling also yes, but within Stocks tech is falling more than the broader market. This is the pattern we saw today. The 10 year sold off 5 bps, the S&P was off 1.2%, and the Nasdaq Composite was off 2.2%. 70% of the down days in equities since June 1 have seen bonds sell off the same day, and in 90% of those down days the Nasdaq has underperformed the S&P 500. The same has been true in reverse, on the up days in bonds and stocks tech has outperformed.
Now there is a macro narrative for this, because the inverse correlation in price between bonds and stocks historically rested on the cyclicality of both. When the economy was strengthening industrial stocks performed well and bonds did not. When in downturns or recessions, cyclical equities underperformed at the same time as bonds outperformed. Tech companies are non cyclicals, their earnings do not correlate to wage growth, or industrial production, inflation or interest rates. But they ARE long dated assets and high multiple companies. And that makes their valuation sensitive to the underlying cost of money. Committed readers will note that I have written whole articles on the cost of money and the history of Irving Fisher.
So what we really are seeing is a VERY strong positive correlation between bonds and tech, with energy and cyclicals following along with slightly weaker inverse correlations along the way. Not driving the market, but also not following the tech vs bonds trend. So what does this mean practically speaking for your portfolio? I’m going to take it the next level for my paid subscribers.
